Champions of the American Dream
Champions of the American Dream
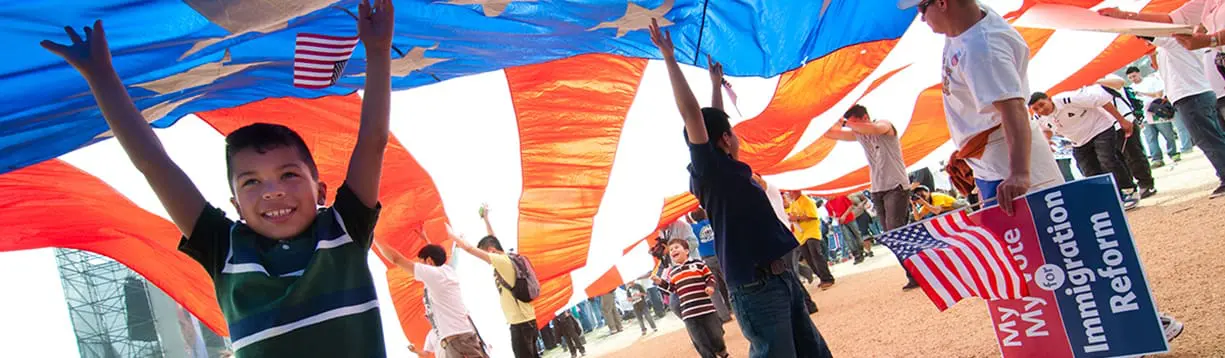
Immigration Rally in Washington, DC ©Ryan Rodrick Beiler
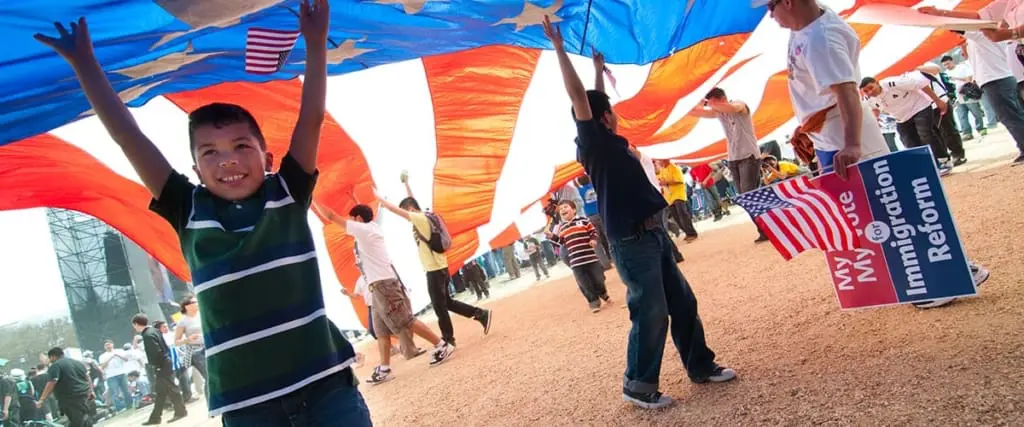
Immigration Rally in Washington, DC ©Ryan Rodrick Beiler
Since our nation’s founding, millions of Latina and Latino immigrants have arrived in the U.S., shaping our food, music, and overall culture, while strengthening and powering our democracy and economic prosperity. They remain to this day the champions of the American dream.
Entry and Trends
Immigrants come to the United States for freedom and opportunity, often fleeing violence, poverty, political instability, and religious or ethnic discrimination and seeking a better life for their families. About one in seven U.S. residents (14%) is foreign-born, a number that reflects the growth of our immigrant population over the past decades. However, immigrants’ share of the population was slightly higher in 1890. In 2023, 45% of immigrants living in the U.S. were Latino. The number of Mexicans entering the U.S. has traditionally been high, given the common border and the U.S. dependence on Mexican laborers, but the level of Mexican immigration has decreased in recent years as the Mexican economy has improved. From 2013 to 2021, India and China were the top origin countries for new immigrants.1
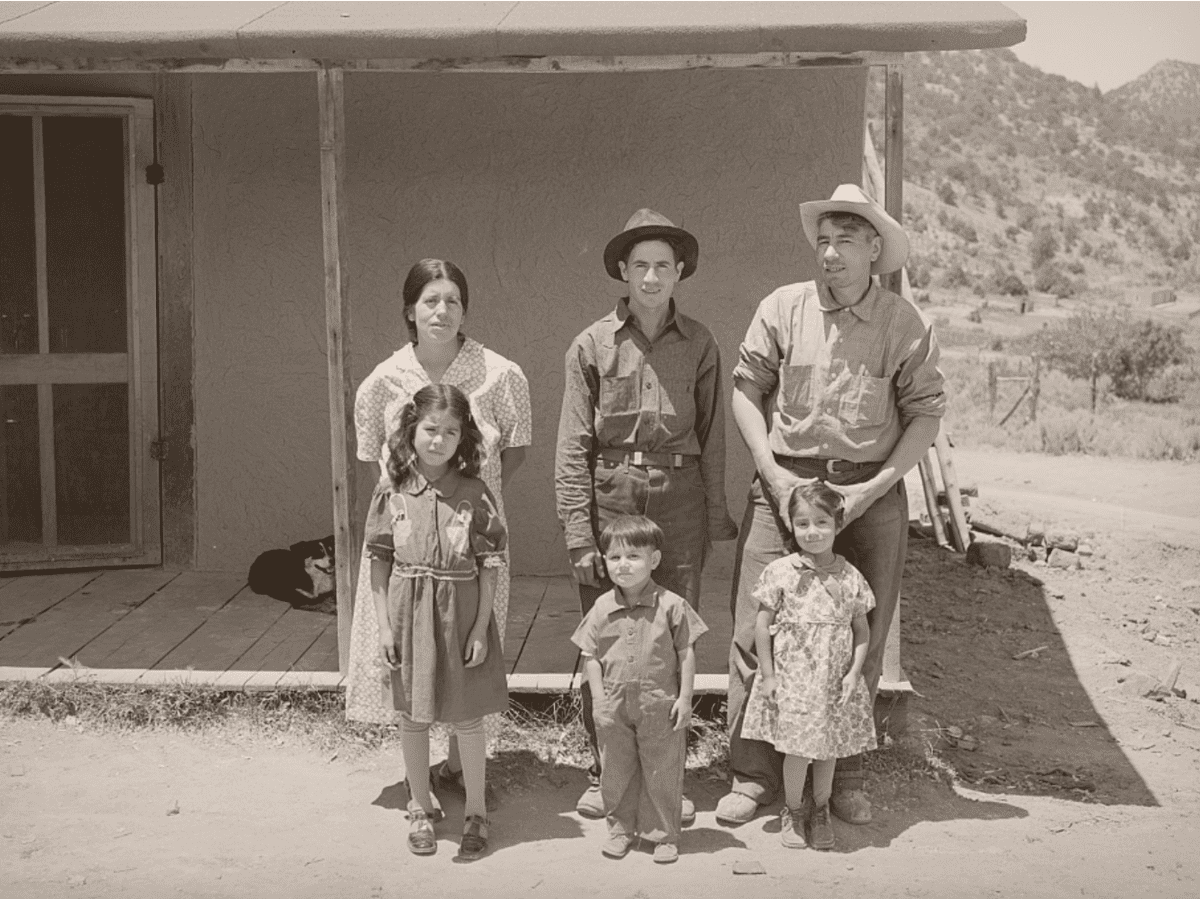
©Russell Lee
The number of Mexicans entering the U.S. has traditionally been high, given the common border and the U.S. dependence on Mexican laborers, but the level of Mexican immigration has decreased in recent years as the Mexican economy has improved.
©Russell Lee
Why is the narrative of immigration so closely tied to Latinos?
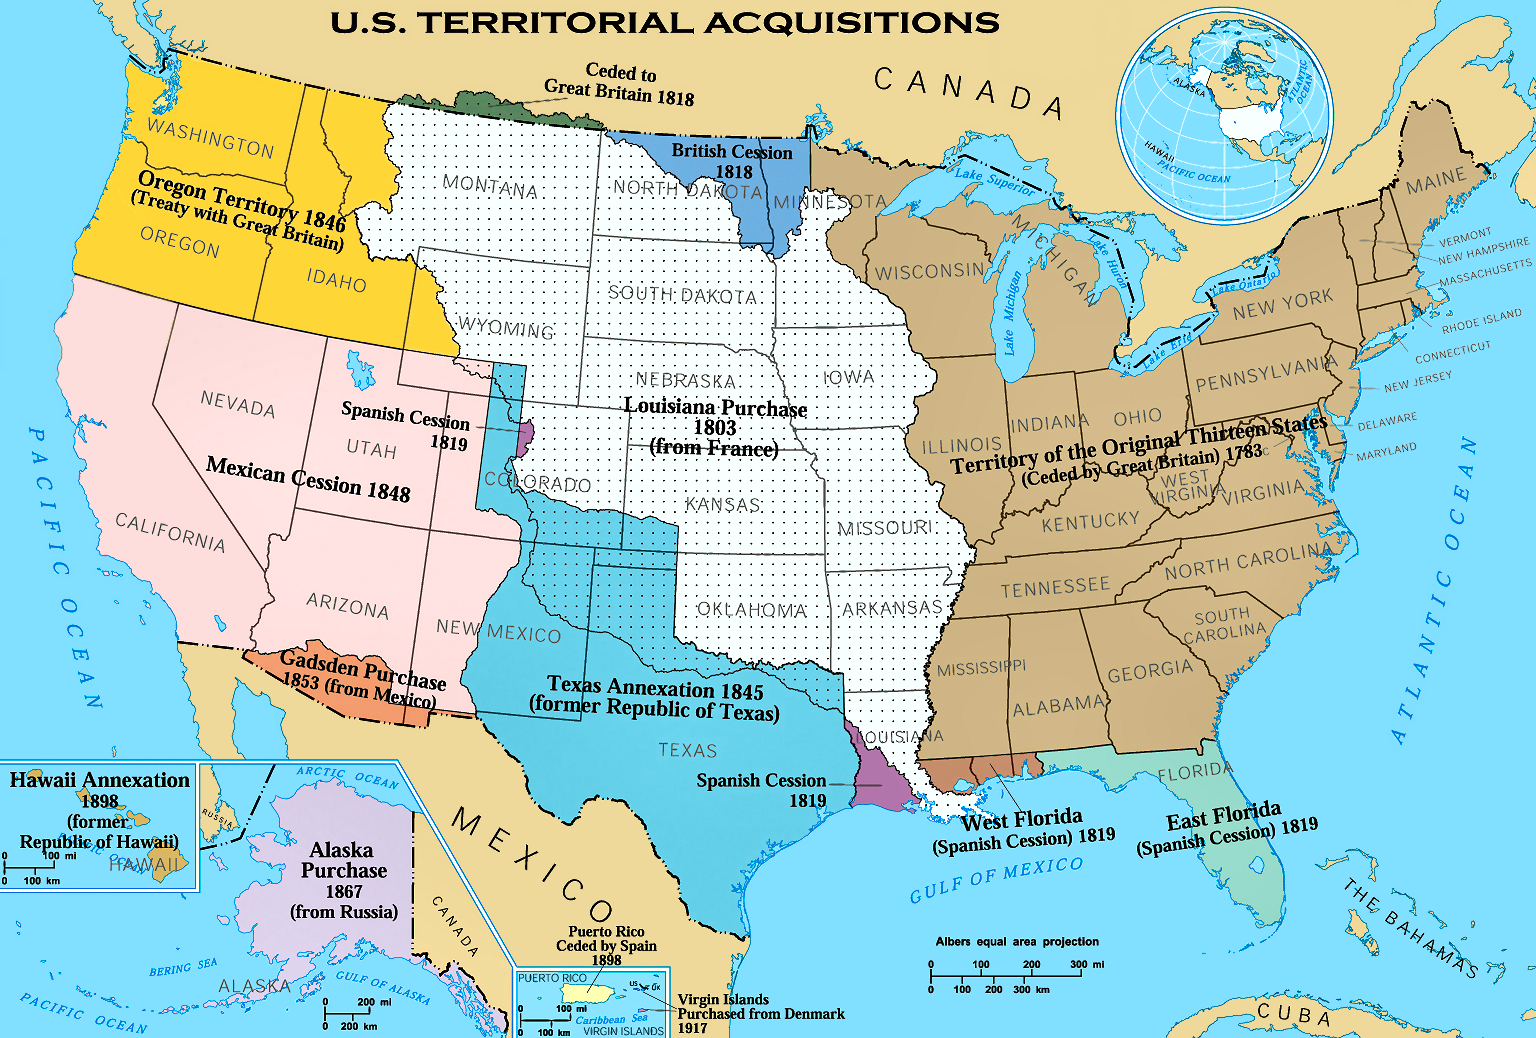
Latinos are often viewed as an immigrant population, but many U.S. Latinos became Americans by conquest or annexation. They trace their roots to Spanish settlers and indigenous peoples in what is now the U.S. starting in the late 1500s. The Spanish settled what is now Florida and New Mexico before the British arrived on the East Coast. Spain controlled Louisiana from 1762-1801, when it came under French control and became part of the Louisiana Purchase in 1803. The U.S. annexed Texas in 1845 and much of northern Mexico in 1848 after the Mexican-American War. Puerto Rico became a colony of the U.S. in 1898 after the Spanish-American War.

Wikipedia 2
How many Latinos are immigrants?
Almost one-third of U.S. Latinos are immigrants; two-thirds are native-born Americans. 3
of U.S. Latinos are immigrants
of U.S. Latinos are native-born Americans
of U.S. Latinos were U.S. citizens in 2021
Latino Citizenship
Four out of five Latinos in the U.S. (81%) were U.S. citizens in 2021,4 and a large minority (43%) of Latino immigrants are naturalized citizens. Almost one-third (31%) have a “green card,” which means they are legal permanent residents. About one in four Latino immigrants are undocumented.5 As of 2019, 95% of Latino children living in the U.S. were citizens.6
Length of Time in U.S.
Three-fourths (77%) of Latino immigrants have been in the U.S. for at least a decade. Only one in eight has been here for less than five years. Immigrants from South America and Central America are more likely than Mexicans to have come in the past five years.7
Language
A large minority (38%) of Latino immigrants 5 and older are proficient in English — they speak only English at home or speak it at least very well — compared to almost three-fourths (72%) of all U.S. Latinos. About 70% speak Spanish at home.8 Spanish proficiency decreases by generation. Three-quarters of U.S. Latinos say they can carry on a conversation in Spanish at least “pretty well,” compared to one-third of Latinos who are at least 3rd generation U.S.-born.9
Undocumented Immigrants[NOT Latino-specific]
Undocumented Immigrants[NOT Latino-specific]
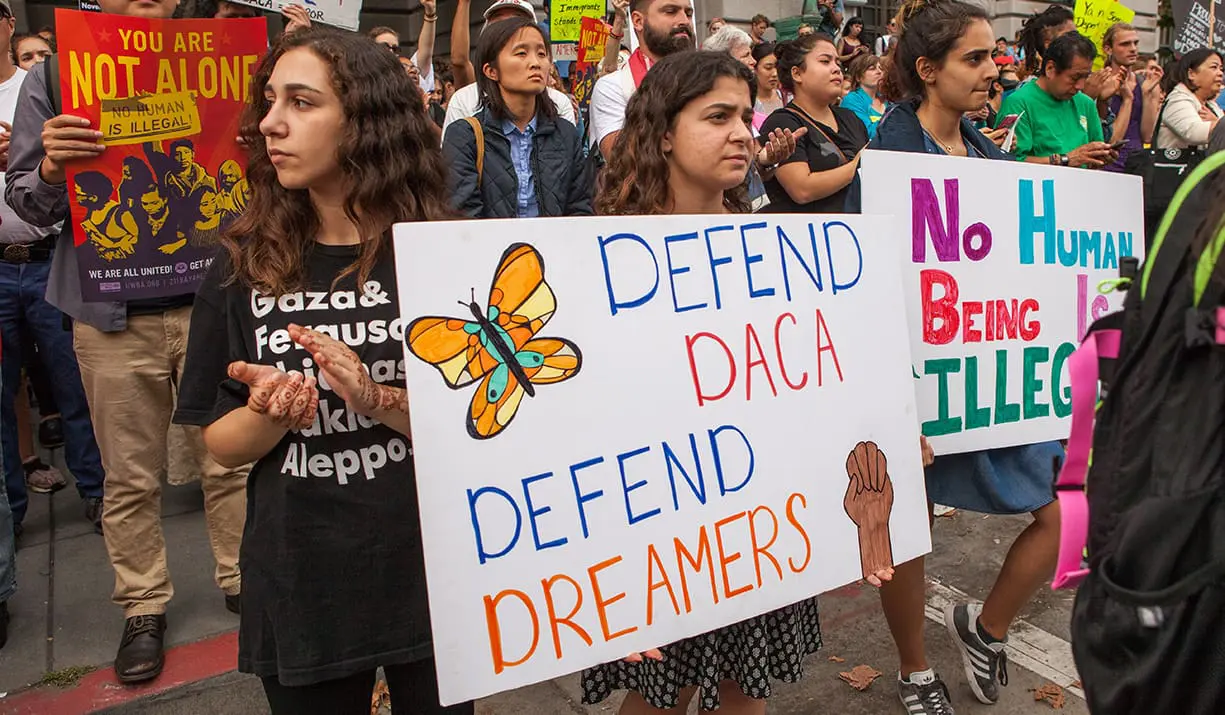
DACA Rally ©Pax Ahimsa Gethen
What is DACA and Who are the Dreamers?
DACA (Deferred Action for Childhood Arrivals) is a program established in 2012 that provides work permits and temporary protection from deportation (renewable every two years) to some young people who entered the U.S. before January 15, 2007, were brought by their families when they were under age 16, are in school or have completed high school or are veterans, and have never been convicted of a felony. The program is currently continuing while challenges to its regulations and continuation remain in the courts. Dreamers are the 900,000 past and current DACA recipients, as well as some other undocumented immigrants who came to the U.S. as minors. As of the end of 2024, there were about 538,000 active DACA recipients. Over 1.1 million people would be eligible if the program were fully reinstated. DACA recipients come from almost 200 countries, but almost 90% are from Mexico, El Salvador, or Guatemala.10
Who are the Undocumented or “Unauthorized” Immigrants?
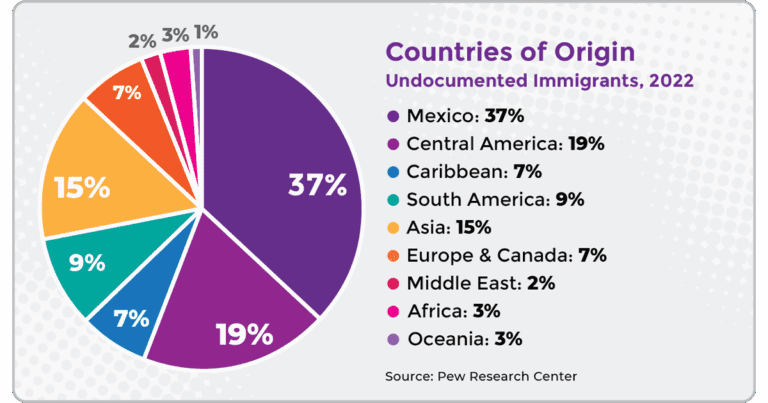
In 2022, there were about 11 million undocumented immigrants in the U.S., about 70% from Latin America.11
Mixed-Status Families
More than four in five undocumented immigrants (81%) live in mixed-status families, where some members are citizens or legal residents. This includes more than 5½ million U.S. citizen children, and more than 1 million children have two undocumented parents.12
TPS
TPS (Temporary Protected Status) is a temporary immigration status used to protect immigrants who cannot return home safely because of situations like an armed conflict, natural disaster, or other humanitarian crisis in their country. As of late 2024, the U.S. had more than 860,000 TPS recipients from 17 countries, among them Afghanistan, El Salvador, Honduras, Nicaragua, Ukraine, and Venezuela. Congress established TPS in 1990. Designations are for 6, 12, or 18 months, and can be extended or ended by the U.S. government with 60 days’ notice.13
Labor Force Participation
Unemployment
Undocumented workers are less likely to be unemployed than other workers. In 2022, their unemployment rate was 3.1%.16
Essential Workers
Undocumented workers keep the U.S. functioning, even during national crises. As of 2020, three-fourths (74%) of them worked in “essential occupations” — jobs where workers help to carry out critical tasks that must be done even during crises like a pandemic or a natural disaster. Less than two-thirds (65%) of U.S.-born workers fit this category.17
of undocumented workers worked in "essential occupations"
amount undocumented workers paid in federal, state and local taxes in 2002
combined buying power of undocumented workers in 2022
Taxes Paid
Undocumented immigrants pay taxes but receive very few benefits. They paid almost $100 billion in federal, state, and local taxes in 2022, nearly $60 billion of which went to the federal government. More than one-third of those federal tax dollars are payroll taxes that help fund Social Security, Medicare, and unemployment uninsurance — programs that these workers cannot access. In 40 states, undocumented immigrants pay higher state and local taxes than the top 1% of households.18
Buying Power
Services Used
Undocumented immigrants are barred from receiving most public benefits and services, like federal nutrition assistance, family assistance, and housing assistance. They are not allowed to buy health insurance through the Affordable Care Act (ACA) and can receive only emergency Medicaid. Even legal permanent residents are required to wait five years before they can receive most public benefits. Most of the children of undocumented workers are native-born, but undocumented children are eligible for a free public education and for school breakfast and lunch programs.21
Effect on the Deficit
A growing undocumented immigrant population could lower the U.S. deficit by nearly $1 trillion between 2024 and 2034, according to the nonpartisan Congressional Budget Office. These immigrants would generate $1,175 trillion in increased federal revenues — $788 billion in taxes and $387 billion in positive effects on the economy. 22
Footnotes
1. “Frequently Requested Statistics on Immigrants and Immigration in the United States,” Migration Policy Institute, 2025, https://www.migrationpolicy.org. 2. Map of U.S. Territorial Acquisitions from Wikipedia, https://upload.wikimedia.org. 3. “8 facts about recent Latino immigrants to the U.S.“, Pew Research Center, 2023, https://www.pewresearch.org. 4. “11 Facts about Hispanic origin groups in the U.S.,” Pew Research Center, 2023, https://www.pewresearch.org. 5. “Most Hispanic Immigrants Say Their Lives Are Better In The U.S. But Face Financial And Health Care Challenges: The 2023 KFF/LA Times Survey of Immigrants,” KFF, 2024, https://www.kff.org. https://www.census.gov. 6. 2019 American Community Survey data, in “Getting Back on Track: A Detailed Look at Health Coverage Trends for Latino Children,” McCourt School of Public Policy, Georgetown University, 2021, https://ccf.georgetown.edu 7. “Most Hispanic Immigrants Say Their Lives Are Better In The U.S. But Face Financial And Health Care Challenges: The 2023 KFF/LA Times Survey of Immigrants,” KFF, 2024, https://www.kff.org. 8. Data from the 2021 American Community Survey (Census Bureau), as reported in “Facts on Latinos in the U.S.,” Pew Research Center, 2023, https://www.pewresearch.org. 9. “Latinos’ Views of and Experiences With the Spanish Language,” Pew Research Center, 2023, https://www.pewresearch.org. 10. Data from U.S. Citizenship and Immigration Services (USCIS), in “Key Facts on Deferred Action for Childhood Arrivals,” KFF, 2025, https://www.kff.org. 11. “What we know about unauthorized immigrants living in the U.S.,” Pew Research Center, July 22, 2024, https://www.pewresearch.org. 12. 2022 Census data, in “Proposed 2024 Mass Deportation Program Would Socially and Economically Devastate American Families,” Center for Migration Studies, 2024, https://cmsny.org. 13. “What Is Temporary Protected Status?” Council on Foreign Relations, 2025, https://www.cfr.org. 14. “Unauthorized immigrants and the economy,” Economic Policy Institute, 2025, https://itep.org. 15. “Hispanic/Latino Health,” Office of Minority Health, based on Census Bureau data, https://minorityhealth.hhs.gov 16. “Unauthorized immigrants and the economy,” Economic Policy Institute, 2025, https://www.epi.org 17. Essential work: Employment and outlook in occupations that protect and provide,” Bureau of Labor Statistics, September 2020, https://www.bls.gov. 18. “Unauthorized immigrants and the economy,” Economic Policy Institute, 2025, https://itep.org. 19. “How Does Immigration Affect the U.S. Economy?” Council on Foreign Relations, 2024, https://www.cfr.org. 20. List of Countries by GDP (Nominal), International Monetary Fund World Economic Outlook, October 2023, https://statisticstimes.com. 21. “Tax Payments by Undocumented Immigrants,” Institute on Taxation and Economic Policy, 2024, https://itep.org 22. “Effects of the Immigration Surge on the Federal Budget and the Economy,” Congressional Budget Office, 2024, https://www.cbo.gov.
Privacy Policy | Accessibility Policy | ©2026 Hispanic Federation. All rights reserved. Built by Social Driver
Privacy Policy | Accessibility Policy | ©2025 Hispanic Federation. All rights reserved. Built by Social Driver