Latinos: Uniting Cultures, Shared Stories and Dreams
Latinos in the United States represent a vibrant and diverse people — a veritable stew of ethnicities and races encompassing Indigenous, African, European, and even Asian roots. Hailing from 20 different origin countries in Latin America, we are united by a common reverence for family, faith, work, and an unwavering belief in the American Dream. The shared experiences of our journeys and struggles — both past and present — serve to bind us, as does the shared language of our ancestors and the food, culture, and traditions from throughout the Americas that form the foundation of our cultural identity and continue to enrich and strengthen the United States.
A Mexican philosopher, José Vasconcelos, described Latinos as the “fifth race” of the American continent, la raza cosmica (the cosmic race), combining European, African, Asian, and Indigenous ancestry. 1
José Vasconcelos, caricature by Lluis Bagaria
Population Size
Latinos are the second largest population group in the U.S. after non-Hispanic Whites. Almost 1 in 5 Americans are Latino. There were about 65 million Latinos living in the U.S. in 2023, according to the Census Bureau, and the 2025 estimated Latino population is almost 67 million.2 One-fourth of the U.S. population aged 0-5 is Latino. 3
DID YOU KNOW?
Approximately every 30 seconds, a Latino in the U.S. turns 18 and becomes eligible to vote. 4
Growth
The Latino population grew by almost 2% between 2022 and 2023, and the greatest growth has been in the South. Immigration plays an important role, but the most important growth factor is natural increase — Latinos are a relatively young population (median age is 30, compared for 39 for the overall population) and they have more births than deaths each year.5 The fastest growing Hispanic group from 2010 to 2021 was Venezuelans. 6
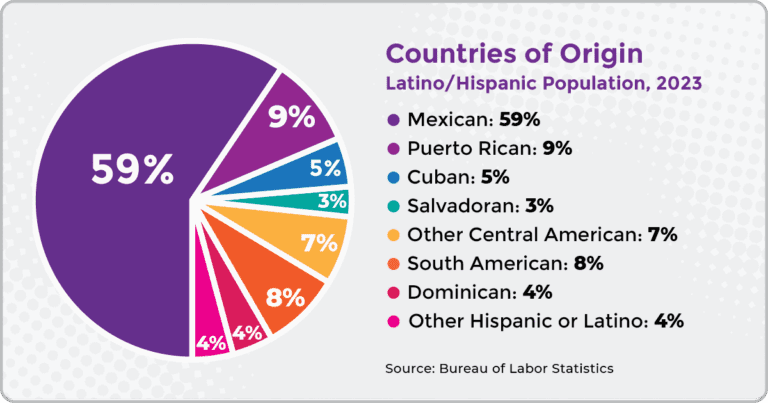
Countries of Origin
As this chart reflects, approximately 60% of the total Hispanic population have Mexican ancestry. The other 40% are a diverse grouping of descendants from the rest of Latin America, including Puerto Ricans, Central Americans, South Americans, Cubans, Dominicans, and others.
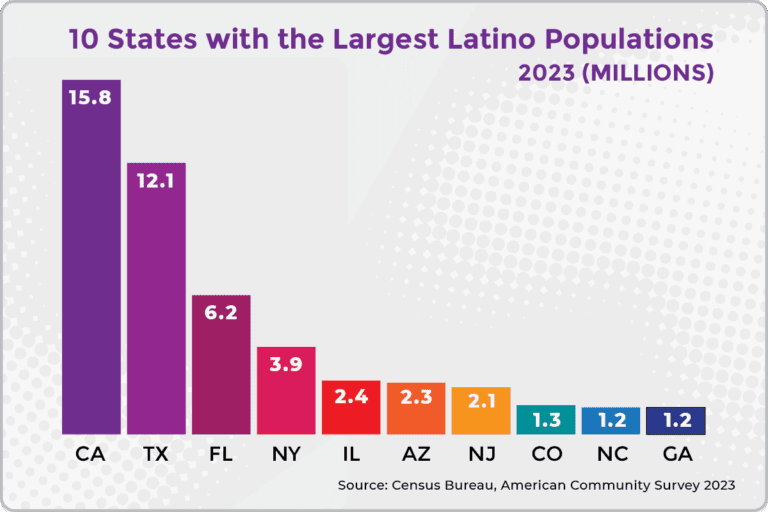
Where Latinos Live
Latinos live in every state and U.S. territory. As the chart shows, the states with the largest Latino populations are California, and Texas. Latinos are the largest single population group in California (40%), Texas (40%), and New Mexico (49%).7
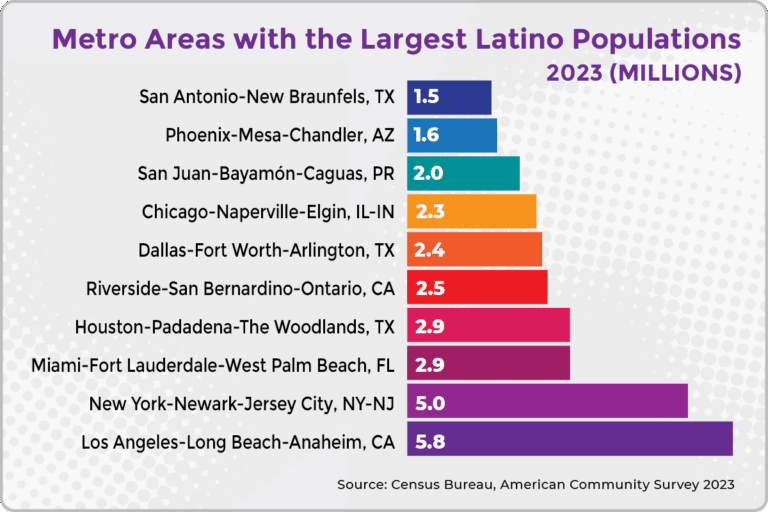
Ten metro areas in seven states and territories had Latino populations of at least 1.5 million in 2023, as the chart below shows. The Los Angeles metro area has the largest Latino population, almost 5.8 million, and 45% of residents are Latino.
Pew Data Fact Sheets by Ethnic Origin
The data in these fact sheets covers everything from educational attainment to language use and homeownership.
The state with the largest percentage growth in Latino population from 2010 to 2020 was North Dakota. 8
Footnotes
1. “The Cosmic Race: La raza cosmica,” 1925, essay by Jose Vasconcelos, https://www.goodreads.com.
2. “Forecast of the Hispanic population of the United States from 2022 to 2060,” Statistica, https://www.statista.com.
3. “One in Four Children Nationwide Are Latino, With 6-to-12-year-olds Making Up Nearly 40 Percent of Latino Children,” National Research Center on Hispanic Children and Families, September 27, 2023
4. “The Latinx Voting Bloc Transformed 2020,” Voto Latino, https://votolatino.org
5. “New Estimates Highlight Differences in Growth Between the U.S. Hispanic and Non-Hispanic Populations,” press release, U.S. Census Bureau June 27, 2023, https://www.hispanicresearchcenter.org. https://www.census.gov.
6. “11 Facts about Hispanic origin groups in the U.S.,” Pew Research Center, 2023, https://www.pewresearch.org.
7. Census Bureau, as reported in “ California’s Population,” Public Policy Institute of California, 2025, https://www.ppic.org; “Latinos now outnumber non-Hispanic whites in Texas, census data shows,” NBC News, 2023, https://www.nbcnews.com; and “New Mexico Data Focus: Hispanic or Latino Ethnicity,” State of New Mexico, 2024, https://www.dws.state.nm.us.
8. “1. A brief statistical portrait of U.S. Hispanics,” Pew Research Center, 2022, https://www.pewresearch.org.